Trusted by high-velocity scientific teams


The intuitive data & analysis platform you've been looking for
Industry-best visualizations, all in one place
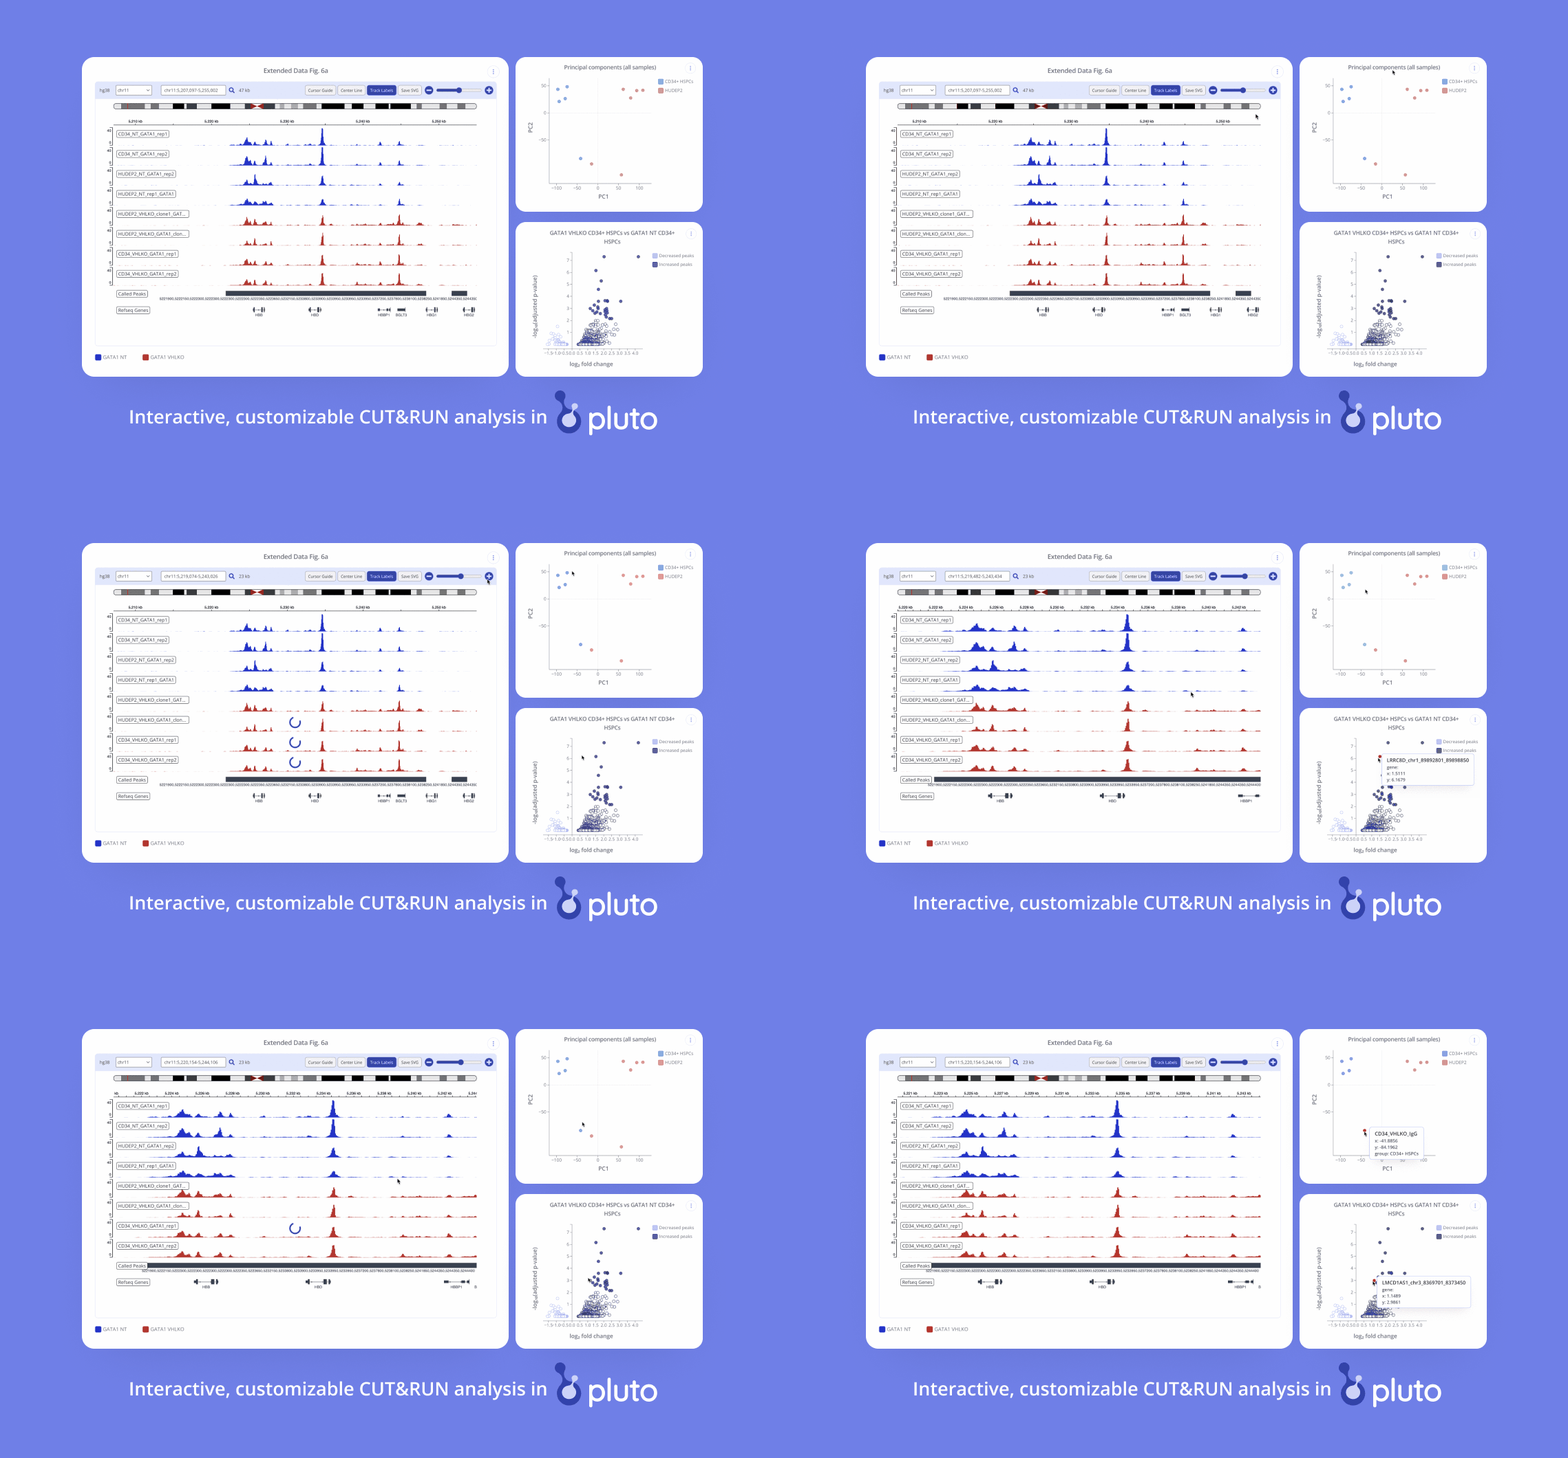
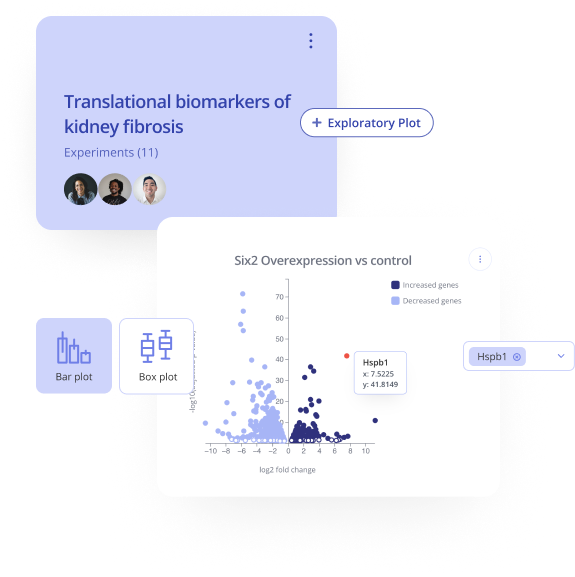
Science moves fast - your team deserves software that can keep up. Instead of using 5+ disparate tools to analyze your CUT&RUN data, create all of the exploratory visualizations you need in one place. Search, embed, and share your results, then customize final, publication-ready figures for export.
Tip: In Pluto, every analysis has its own, fully dynamic methods section, including all analysis parameters and relevant references.

Built for scientific teams that scale: No per-sample or per-user costs
Single annual platform fee, so your team knows the entire cost upfront. No uncontrolled costs, or using fewer samples to minimize expense.
Customizable, publication-quality results and figures
Easily customize colors and visual appearance for beautiful plots, every time. Apply company-approved color palettes for consistency.
We manage the pipelines so you don't have to
70% of teams time is spent managing the systems to support the analysis. We do this for you, so you can spend 100% of your time making discoveries.
Flexible and data-driven to support different experimental designs
- Annotate samples with relevant metadata
- Your annotations customize analyses
- R&D, preclinical, or clinical sample types
- Organize both in vivo and in vitro studies
Native analysis and visual capabilities for CUT&RUN data
- FASTQ file storage
- Alignment and processing pipeline
- Detailed QC metrics and reporting
- Interactive, biology-focused analysis
Plus, support for 20+ more assays, all in one platform
- Epigenetics
- Transcriptomics
- Low-throughput assays (e.g. qPCR, ELISA)
- And more!
Side by side analysis
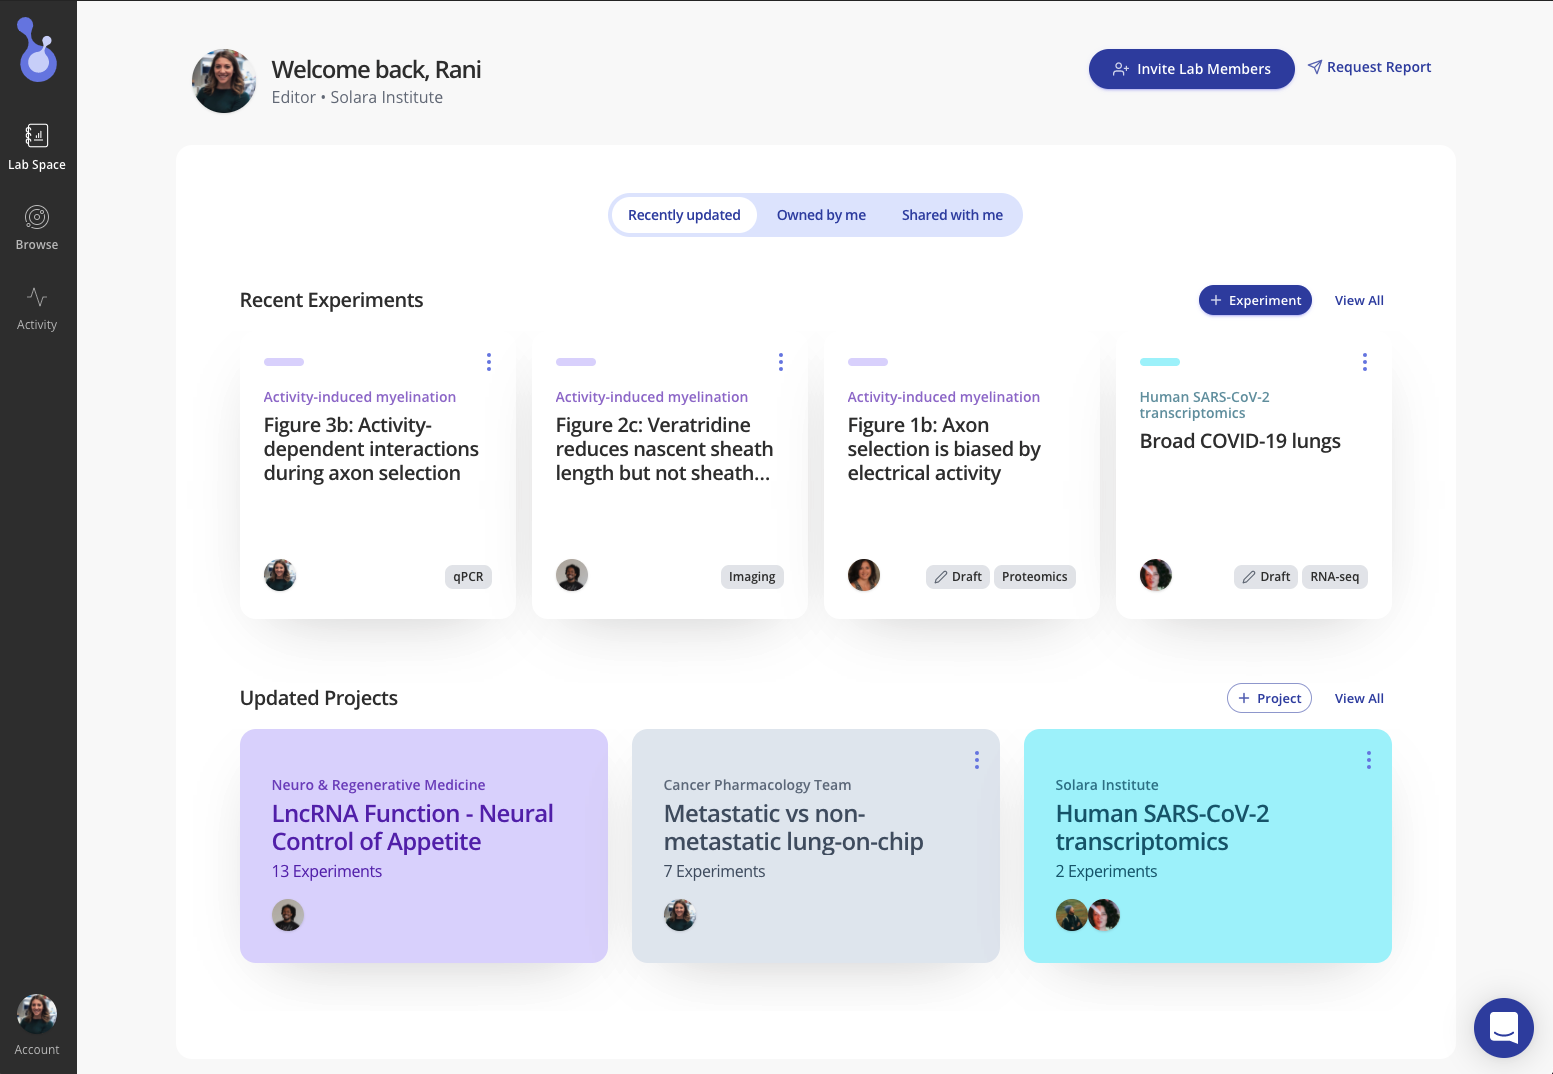
Store multiple CUT&RUN experiments in Pluto for comparison and organization
Collaborate and share, securely
Invite internal or external collaborators with role based permissions.
See it in action, schedule a demo today
Beyond CUT&RUN Pluto can manage RNA-seq, low throughput experiments, and much more.

Analysis and plot types
Differential binding analysis
Identify targets that are differentially bound under different conditions
Calculate statistically significance using bioinformatics best-practices (no coding required)
Peak analysis and IGV plots
Visualize signal-to-background
Look at peaks of interest in different samples with integrative genome viewer (IGV)
Pathway analysis
See top changed pathways and compute pathway-level statistics
Summarize counts with bar, box and heatmap plots
Visualize intra-sample variability with normalized or raw counts
Longitudinal analysis with line plots
See how binding changes over time or with increasing dose
Dimensionality reduction analysis
See how your samples cluster over time or with increasing dose
Pluto has more analysis and plot types - talk to our science advisors about how we can make Pluto work for you
© 2022 Pluto Biosciences, Inc. Privacy Policy Terms of Use

