Streamlined CUT&Tag analysis without delays or handoffs
Schedule your personalized demo to see how Pluto makes it easy to process CUT&Tag data, compare experimental conditions, and generate custom reports within one platform.

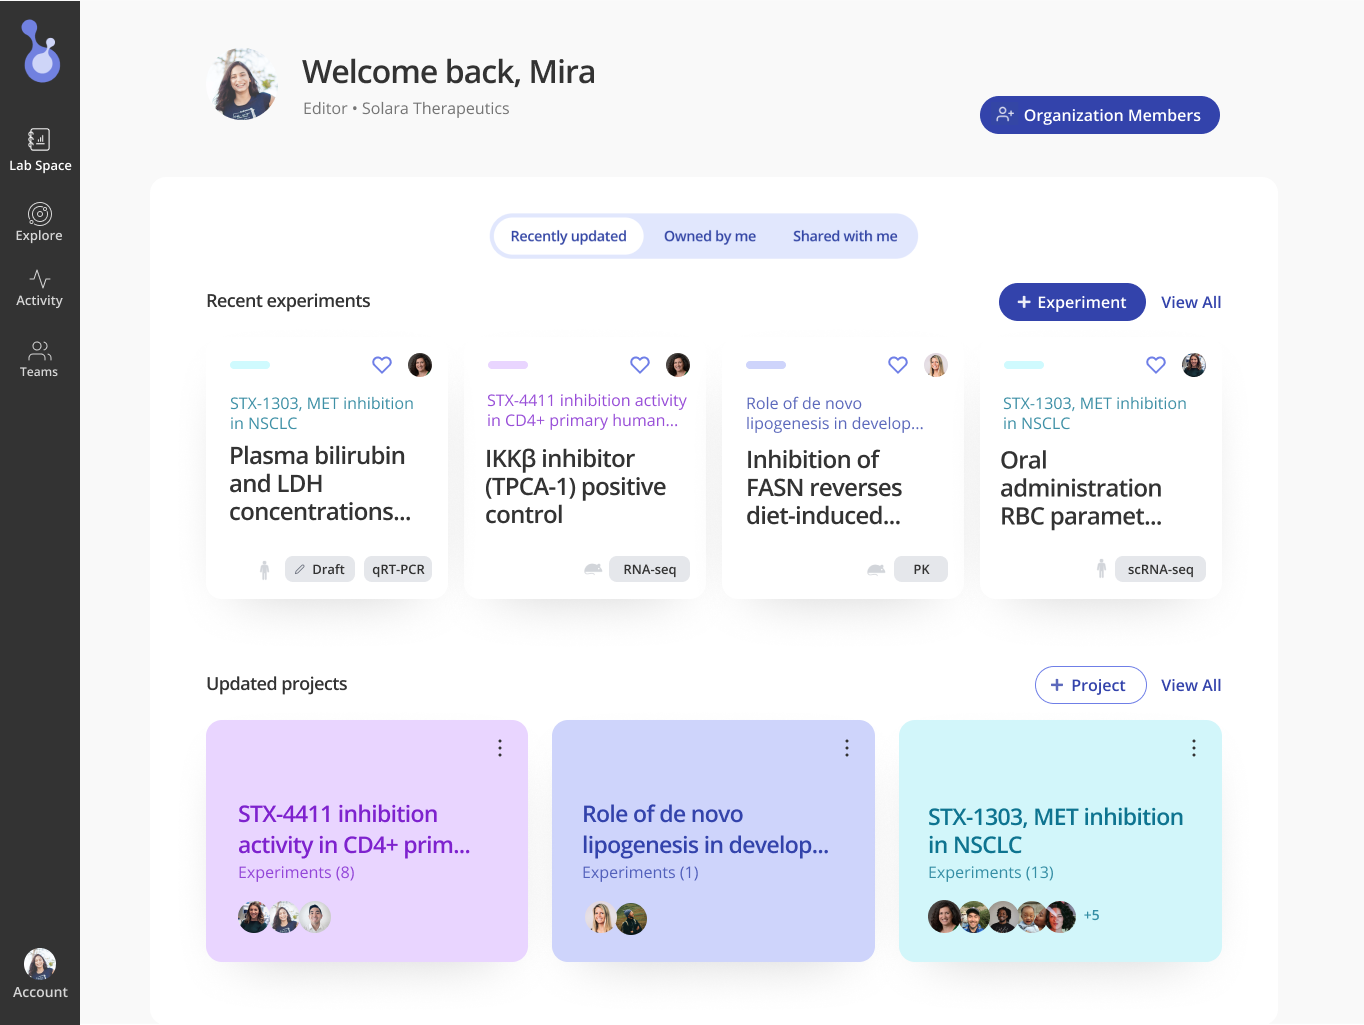
Streamlined data management, analysis, and visualization
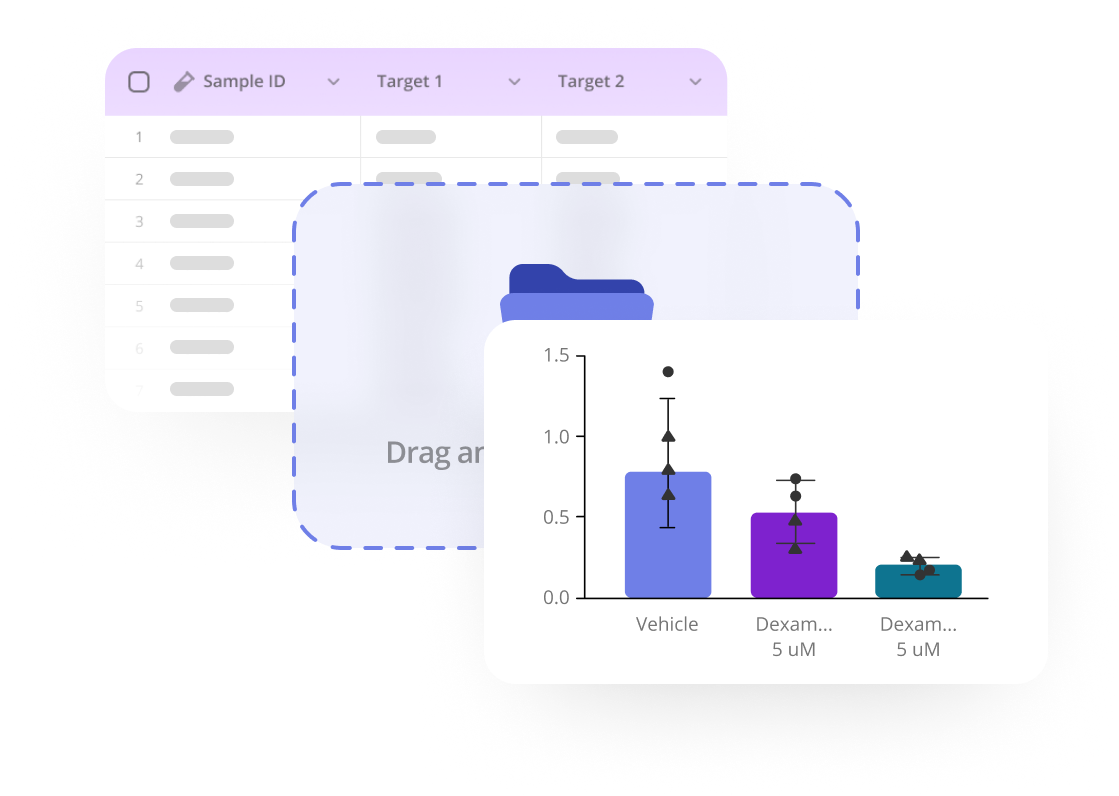
Pluto is an end-to-end discovery platform built for life science teams. Get started analyzing your sequencing data in minutes, with no need to set up bioinformatics pipelines or manage infrastructure.
Tip: Pluto supports 20+ assays including RNA-seq, CUT&RUN, ChIP-seq, and many others. You can upload FASTQ files or tabular results to begin visualizing results right away!
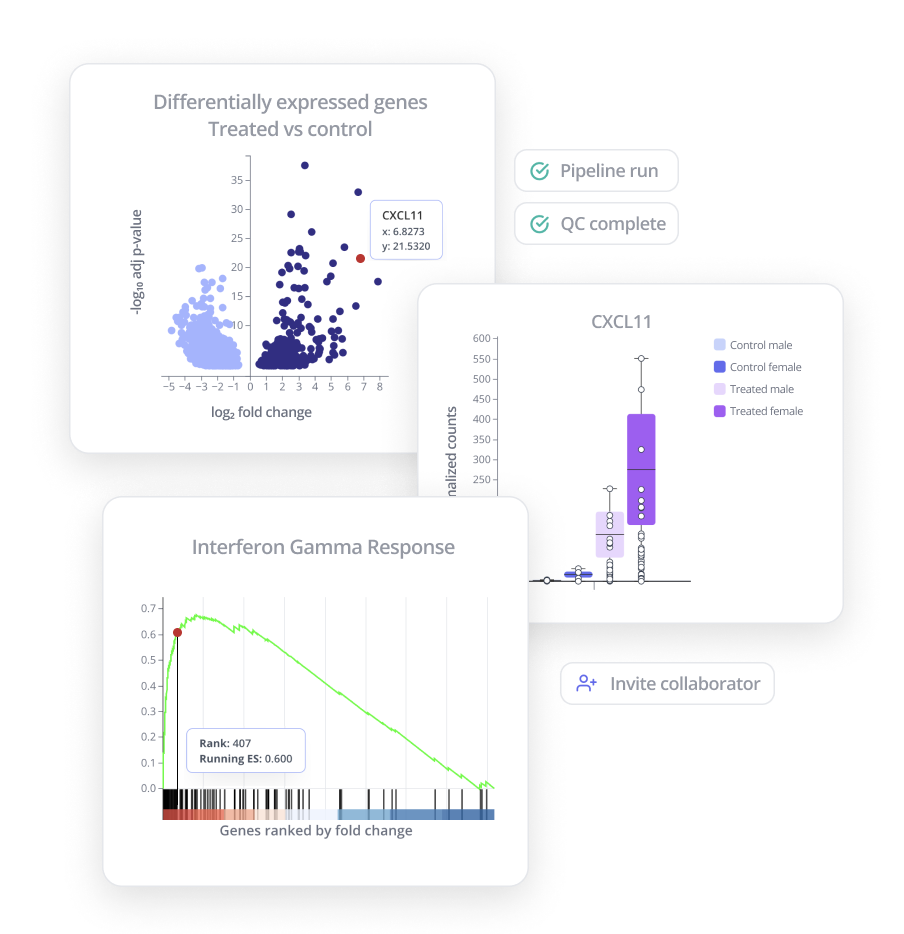
Publication-quality figures in minutes
Science moves fast - your team deserves software that can keep up. Instead of using 5+ disparate tools to analyze your data, use Pluto to create all of the exploratory visualizations you need in one place. Search, embed, and share your results, then customize final, publication-ready figures for export.
Tip: In Pluto, every analysis has its own, fully dynamic methods section, including all analysis parameters and relevant references.
Built for scientific teams that scale: No per-sample or per-user costs
Native analysis and visual capabilities for high- and low-throughput data
Store multiple experiments for comparison and organization
Flexible and data-driven to support different experimental designs
Customizable, publication-quality results and figures
We manage the pipelines so you don't have to
Support for 20+ more assays, all in one platform
Collaborate and share, securely
